1
2
3
4
5
6
7
8
9
10
11
12
13
14
15
16
17
18
19
20
21
22
23
24
25
26
27
28
29
30
31
32
33
34
35
36
37
38
39
40
41
42
43
44
45
46
47
48
49
50
51
52
53
54
55
56
57
58
59
60
61
62
63
64
65
66
67
68
69
70
71
72
73
74
75
76
77
78
79
80
81
82
83
| import numpy as np
import matplotlib.pyplot as plt
import matplotlib.animation as animation
def target_pdf(x):
p1 = 0.7 * np.exp(-0.5 * ((x + 2) / 1)**2) / (np.sqrt(2 * np.pi) * 1)
p2 = 0.3 * np.exp(-0.5 * ((x - 4) / 1.5)**2) / (np.sqrt(2 * np.pi) * 1.5)
return p1 + p2
def get_score(x):
p = target_pdf(x)
grad_p1 = 0.7 * np.exp(-0.5 * ((x + 2) / 1)**2) / (np.sqrt(2 * np.pi) * 1) * (-(x + 2) / 1**2)
grad_p2 = 0.3 * np.exp(-0.5 * ((x - 4) / 1.5)**2) / (np.sqrt(2 * np.pi) * 1.5) * (-(x - 4) / 1.5**2)
grad_p = grad_p1 + grad_p2
return grad_p / (p + 1e-10)
n_particles = 2000
n_steps = 500
tau = 0.1
noise_scale = np.sqrt(2 * tau)
x_opt = np.random.uniform(-8, 10, n_particles)
x_sample = x_opt.copy()
for t in range(n_steps):
score_opt = get_score(x_opt)
score_sample = get_score(x_sample)
x_opt = x_opt + tau * score_opt
noise = np.random.normal(0, 1, n_particles)
x_sample = x_sample + tau * score_sample + noise_scale * noise
fig, axes = plt.subplots(1, 2, figsize=(14, 6), sharey=True)
x_grid = np.linspace(-8, 10, 1000)
true_pdf = target_pdf(x_grid)
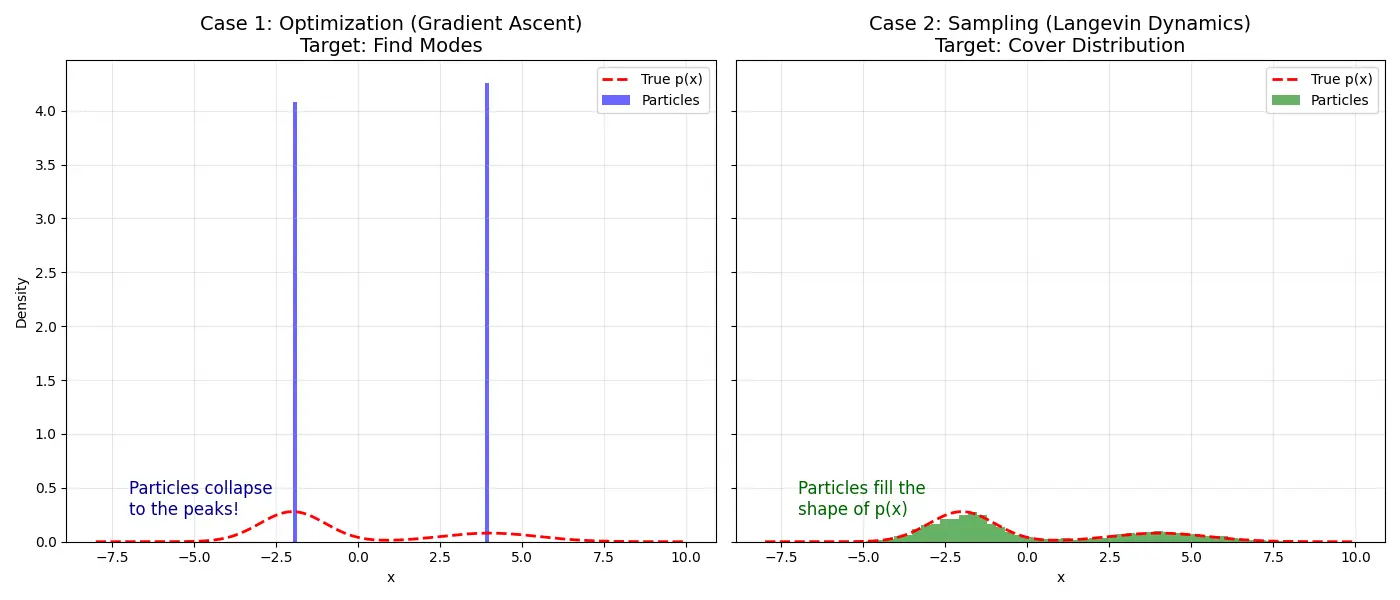
axes[0].plot(x_grid, true_pdf, 'r--', label='True p(x)', lw=2)
axes[0].hist(x_opt, bins=50, density=True, color='blue', alpha=0.6, label='Particles')
axes[0].set_title('Case 1: Optimization (Gradient Ascent)\nTarget: Find Modes', fontsize=14)
axes[0].set_xlabel('x')
axes[0].set_ylabel('Density')
axes[0].legend()
axes[0].grid(True, alpha=0.3)
axes[0].text(-7, 0.25, "Particles collapse\nto the peaks!", fontsize=12, color='darkblue')
axes[1].plot(x_grid, true_pdf, 'r--', label='True p(x)', lw=2)
axes[1].hist(x_sample, bins=50, density=True, color='green', alpha=0.6, label='Particles')
axes[1].set_title('Case 2: Sampling (Langevin Dynamics)\nTarget: Cover Distribution', fontsize=14)
axes[1].set_xlabel('x')
axes[1].legend()
axes[1].grid(True, alpha=0.3)
axes[1].text(-7, 0.25, "Particles fill the\nshape of p(x)", fontsize=12, color='darkgreen')
plt.tight_layout()
plt.show()
|